
The Education Data Fetish
It was December 2015, and President Obama just got a rare landslide bipartisan win: 85-12 in the Senate and 359-64 in the House. The cause had united labor unions and conservatives alike. What could have brought such disparate groups together in what Obama called a “Christmas miracle”?
No Child Left Behind (NCLB)–the much-maligned Bush-era education law–was getting left behind. For over a decade, politicians on both the left and the right criticized NCLB’s test-and-punish approach, whereby schools that did not meet performance growth on standardized tests for various demographic groups could risk losing funding.
Six years later, though, teachers are inundated with more data and accountability measures than ever, thanks in part to NCLB’s successor, the Every Student Succeeds Act (ESSA). While ESSA replaced the most punitive elements of NCLB, its architects still adhered to the culture of accountability and quantification. At the time, Obama said: “The goals of No Child Left Behind, the predecessor of this law, were the right ones: High standards. Accountability. Closing the achievement gap.”

President Obama and Secretary Duncan discussing Race to the Top (2009), Public Domain
ESSA was just the latest iteration in a decades-long push toward quantifying the unquantifiable. Just six years earlier, Secretary of Education Arne Duncan and President Obama pioneered “Race to the Top,” a product of the 2009 stimulus package that incentivized states to reform their education systems. As Dana Goldstein discusses in her 2014 book The Teacher Wars, states were encouraged to use, among other things, standardized testing as a way to hold teachers accountable and to expand the kinds of data collected by schools.
Despite the Obama administration’s claims that ESSA would be different from NCLB, in reality, it just expanded what it meant to be accountable, paving the way for education measurements detached from actual educational value or validity. It still mandated yearly testing, for example, but it left it to states to determine what to do with the data. It encouraged states to use other quantifiable measures, like four-year graduation rate, while continuing to ignore the obvious: that attaching a reward to a measure like four year graduation rates merely incentivizes schools to push through students who are not ready to graduate in order to inflate numbers. And it implored schools to find ways to measure school culture, such as through surveys.
Every part of the school was to be quantified and measured; data was, and continues to be, truth. And this has had predictable outcomes: administrators and policymakers push to increase measures that may have little validity and which may not even be helpful to actual education.
Much of the quantification is little more than reading tea leaves with a veneer of objectivity and science. Well-intentioned administrators push for teachers to continue to look at the numbers, because the data are allegedly more objective and “rigorous” than mere qualitative observation. But what happens when the things we measure aren’t important, the way we measure is bad, and the people interpreting the data don’t have training to interpret data?

President Obama Signing the Every Student Succeeds Act (2015), Public Domain
Quantifying Everything, Everywhere, All At Once
Quantification satiates deeply rooted cravings in the American psyche: the desire to impose logic on a messy process like learning; the belief in efficiency and thriftiness; and market principles for solving social problems.
America’s obsession with quantification is as old as public schools themselves–the first standardized tests were administered in Boston in 1845. In the early 1900s, efficiency-minded progressive reformers measured everything from students’ IQs to the number of urinals needed to optimize a boys’ bathroom. But our current iteration of quantification dates back to the 1960s.
In 1965, Lyndon Johnson signed the Element and Secondary Education Act (ESEA). Among other things, it provided funding for poor students through Title I, which is still in existence today. The problem was, it was clear in the first years of the program that not all of the money was actually making its way to the students it aimed to serve, and so the federal government started mandating reporting requirements in an effort to hold states accountable.
Later, the question transformed from “Is the money being spent on poor students?” to “is the money that we are spending actually having an impact?” This was combined with the alarming government report A Nation At Risk in 1983, which called for increased funding to counteract the collective brain rot that was apparently happening in American schools.
At the same time, academics in the Chicago School of Economics were pushing the idea that free market principles ought to govern public goods like education, and that if parents were provided with the right data, they could best choose the school to send their kids to. As a result, the 90s and 2000s saw an exponential rise in standardized testing and standards in an attempt to hold schools accountable.
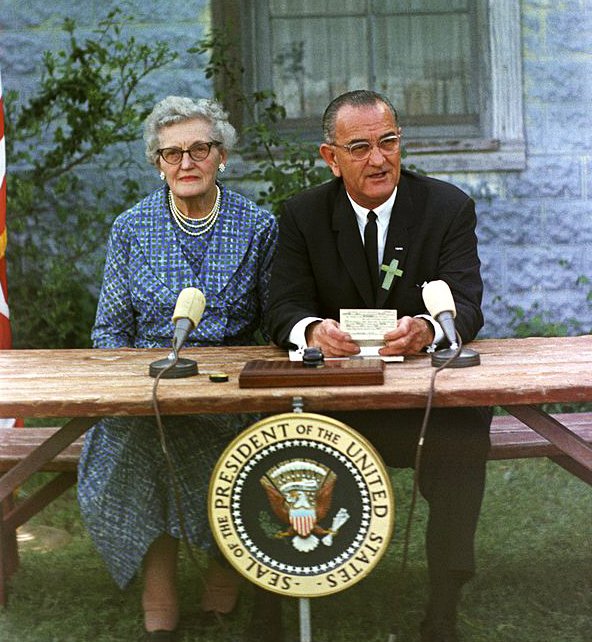
President Lyndon B. Johnson signs the Elementary and Secondary Education Act with his childhood teacher, Ms. Kate Deadrich Loney (1965), Public Domain
Are we measuring anything that matters?
But were the data that schools and states were collecting actually representative of good (or bad) education? By now, most people involved in education understand that questions on a multiple choice test, at best, only show a small part of quality education. But if they are the only thing that is measured, then schools are incentivized to cater their education toward the measurement–to teach to the test. This, in turn, devalues other things that most people value in education: learning how to work with others, how to persevere, how to love learning.
So what did the reformers do next? They tried to quantify emotions (remember: ESEA encouraged schools to find ways to measure non-academic elements of schools). At my school (and throughout the New York City department of education), teachers and students have been asked to use Panorama, a survey that focuses on students’ social-emotional wellbeing–to the tune of $10.5 million in 2017. Teachers who have received no training on psychological evaluation rate students on a battery of social traits like patience and positivity. Students rate themselves on similar questions.
The intent of the survey is good: we should care about our students’ wellbeing and we should care about schools’ relationships with their families. And the administrators pushing them are likely well-intentioned.
But do these surveys actually have any validity? Policymakers and school leaders certainly treat them like they do. Indeed, most of these measures are used uncritically, with the assumption that they reveal “the truth.”
J.M Beach (2021) argues, though, that there are numerous problems with student surveys:
Are teenagers capable of accurate self-reflection? (Not without a lot of coaching.)
Humans, in general, have a deeply ingrained tendency to both lie and to view ourselves positively
Immature teenagers resentful of school authority may simply lie on the survey for no other purpose than to mess with the results.
Do teenagers and parents posses the expertise to fairly evaluate how their teachers are performing, or do they base ratings off of things like a perceived unfair grade? (In many cases, the latter.)
And all of this is in New York, with a strong Teachers Union. In Texas, where protections for teachers are much weaker, one teacher on Reddit reports:
My Tx district uses Panorama as part of our evaluation system. We actually get graded by the kids. The questions are confusing, and a neutral response is actually counted as a negative response.The sampling method (which kids are surveyed) is flawed. I've had kids tell me that they gave me really good scores but felt they had to give me at least one bad score just so the survey didn't look bad. I've had kids tell me that they that they gave me low scores bc they were mad at me or just to fuck with me. When I explained that their answers would affect whether or not I get a raise or even keep my job, they were shocked.
Compounding all of this, software companies then present very unscientific data in a way that makes it appear very scientific to the layperson. Greg Watson (2016) says, “Using a tracking system, for instance, isn’t data. It can make for very attractive dashboards and look superficially scientific, but it is in essence an accumulation of subjective observations.”
Do we even know what the data mean?
In the 90s and 2000s, policymakers sounded the alarm, when it appeared that student SAT scores were declining–when, in reality, more students from previously underrepresented groups and potential first-generation college students were taking the SAT (Goldstein 2014). Most people looking at education data have little concern for whether or not they are actually interpreting data in a statistically sound way–they just want numbers to provide them cover or justification for their decisions, relying on most people’s inexperience with understanding data (or lack of interest in staring at an Excel spreadsheet). In other words, data is often used by administrators and policymakers to justify their ideology-driven decisions under the guise of science.
The most prevalent instance of data misuse is omitted variable bias. When teaching statistics in my 12th grade civics class, I always tell students that in order to attribute a cause-and-effect relationship to something, you must eliminate alternative explanations. In reality, most test scores can be explained by factors completely outside of school control, like parental income and education level, disability status, and neighborhood (and school) segregation. By asserting that it is, in fact, the schools and teachers that are responsible for test score increases, failures in education are seen not as a problem with the welfare state or with segregated neighborhoods but, rather, moral failures of schools, teachers, students, and parents.
Similarly, when student scores go up, it is assumed that students are learning more. In reality, increased test scores are an indicator that teachers are teaching to the test more.
And none of this even accounts for the effects of randomness and other uncontrollable (and sometimes controllable) factors that may make the data difficult to interpret. Take this into consideration: it is not uncommon for schools to implement a MAP test across many days, different times of the day, etc.--computing has lowered the cost of entry to administer a test, but it also has decreased control over the setting and introduced more randomness into the data’s collection. (Educators will know all to well MAP tests–they are adaptive tests created by NWEA, a private nonprofit company, which strives to measure students’ math and reading abilities. Many schools perform these low-stakes tests–independent of high-stakes standardized state tests–a few times per year to internally measure student growth and gather information.)
Informal tests can be great in some ways, but do they provide us with any useful information? In an effort to get away from high stakes testing but to keep testing for informational purposes, we have reduced any incentive for students to take the tests seriously. Many will out of good will, but many won’t, instead clicking randomly on questions.
What does it all mean?
Throughout my career, when I have brought up simple data analysis in meetings looking at data, I have usually been told something to the effect of, “Well, this is just for internal purposes, so it’s okay if our analysis isn’t super rigorous.” The problem is, proper handling and understanding of data is important if you’re using it to make any decisions.
Take for instance an example from last school year. On our 6th grade team, we were discussing the troubling results of our students’ MAP reading scores. Our administration was concerned that the average reading score for students with IEPs (that is, students with disabilities) had fallen relative to our students without disabilities. I chimed in: had we looked at the distribution of the data?
Looking at the data, we found that there were two outliers–students whose scores suggested they became several grade-levels worse in reading in a four month period. It also happened to be that these students didn’t really take the test; we were in remote learning, and these students had essentially guessed on every question. Removing these two outliers, our students with disabilities….actually had more growth than our students without IEPs.
The Every Student Succeeds Act has seemingly been a more progressive shift away from No Child Left Behind. Supposedly progressive policymakers in the Obama administration have us still convinced that data are important for education decision-making, but that we must quantify MORE things, like social-emotional learning. But the way in which data are collected and interpreted often make the results nonsensical, and instead datafication and quantification are only used to justify decisions; they are the equivalent of consulting the oracle or casting bones. Administrators and policymakers would be wise to scale back what is actually quantified, accept other qualitative ways of knowing as valid, and teach stakeholders how to interpret data and understand its limitations.